Observability
Observability collates logs from across the whole ZAI platform — the ZAI App, the Middleware, and the Tool Agent — into a single searchable view. Use it to investigate an error, watch log volume trends, or check how much of your log storage budget is being used.
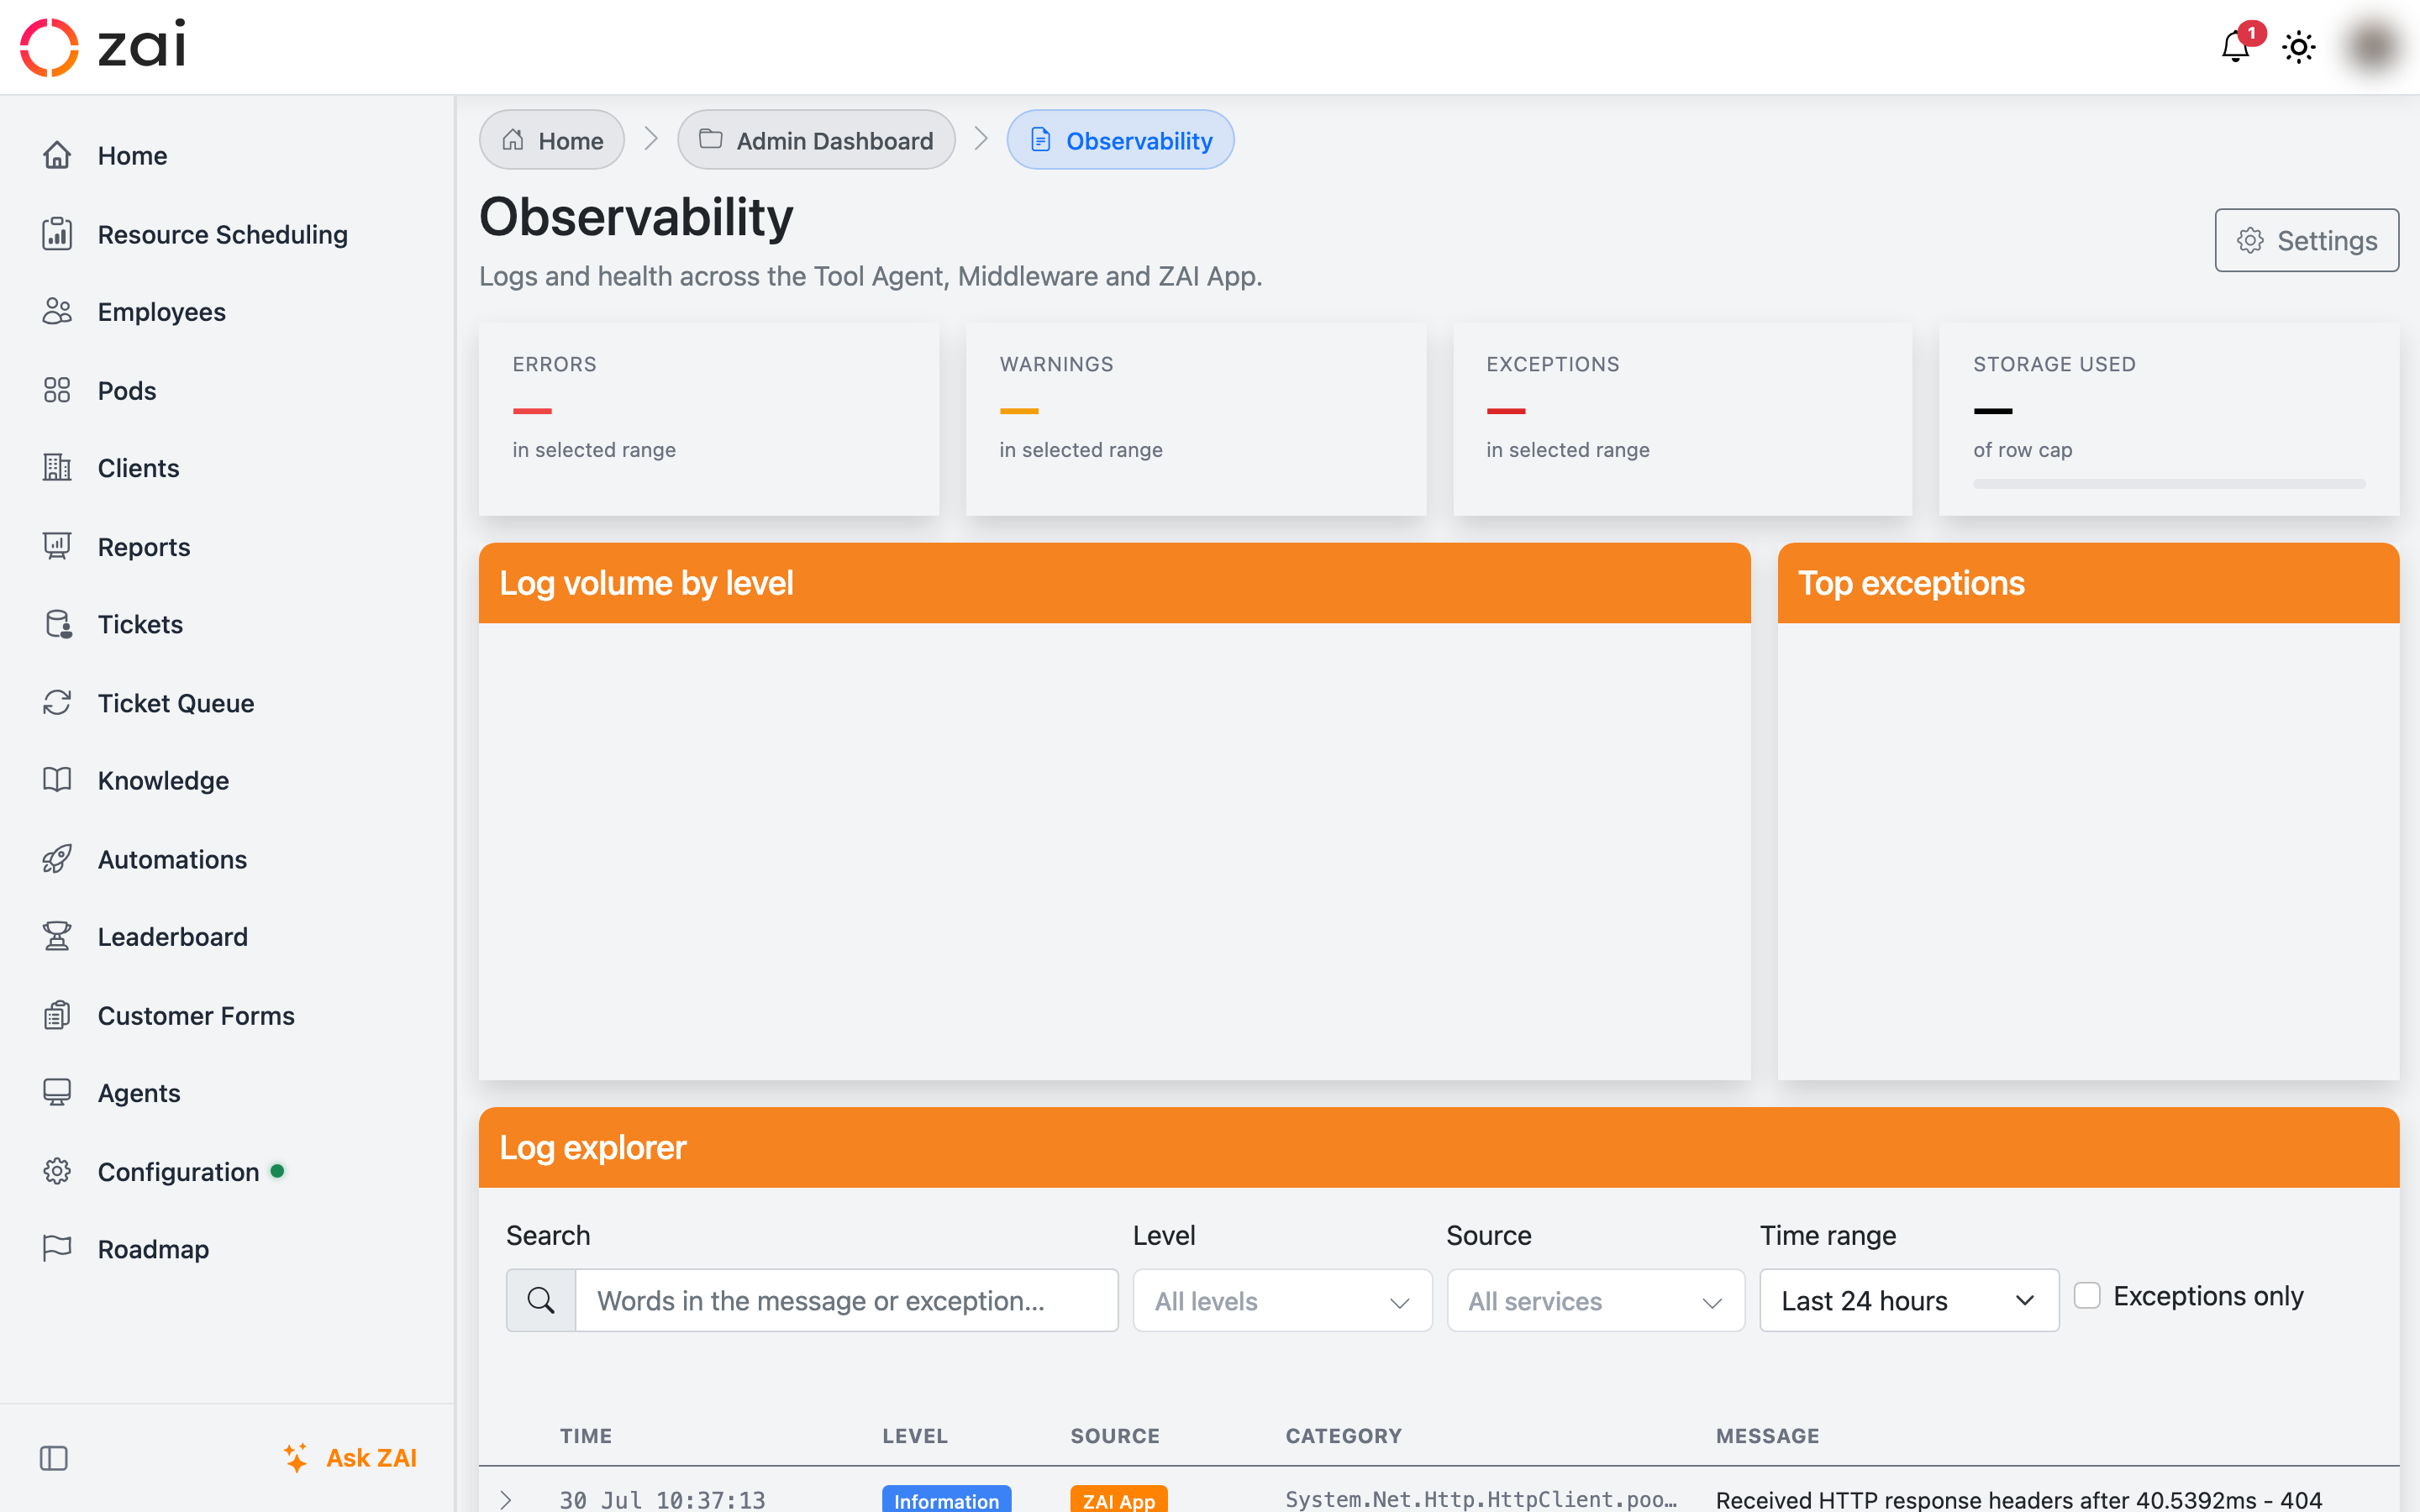
Overview
Each service ships its logs to a shared queue. ZAI drains that queue in bulk and writes the events into one table, so you can search "what happened across the whole platform in the last hour" without opening three different log sources.
The page is split into three parts:
- KPI tiles — counts of errors, warnings, and exceptions in the selected time range, plus how much of your storage cap is currently used.
- Charts — log volume by level over time, and the top recurring exception types.
- Log explorer — a filterable, paginated table of individual log rows, with full detail (message, stack trace, properties) available on expand.
The page reports on itself
If a chart or the log table fails to load, that failure is itself logged as an Observability error — so a broken query shows up as a row in the log explorer rather than disappearing silently.
Getting started
Navigating to Observability
Go to Admin Dashboard → Observability.
Filtering logs
The log explorer's filter bar controls both the table and the charts above it:
- Search — matches words in the log message or exception text.
- Level — Trace, Debug, Information, Warning, Error, Critical (multi-select).
- Source — Tool Agent, Middleware, or ZAI App (multi-select).
- Time range — presets from the last 15 minutes up to 30 days, or a custom
From/Torange. - Exceptions only — narrows the table to rows that carry an exception.
Results update as you change any filter — there's no separate "search" button to click.
Reading a log row
Click a row to expand it. The summary table only carries the message and level; the full exception stack trace and any structured properties are loaded on demand, so expanding a handful of rows to investigate an incident doesn't slow down the rest of the table.
Key concepts
Storage limits
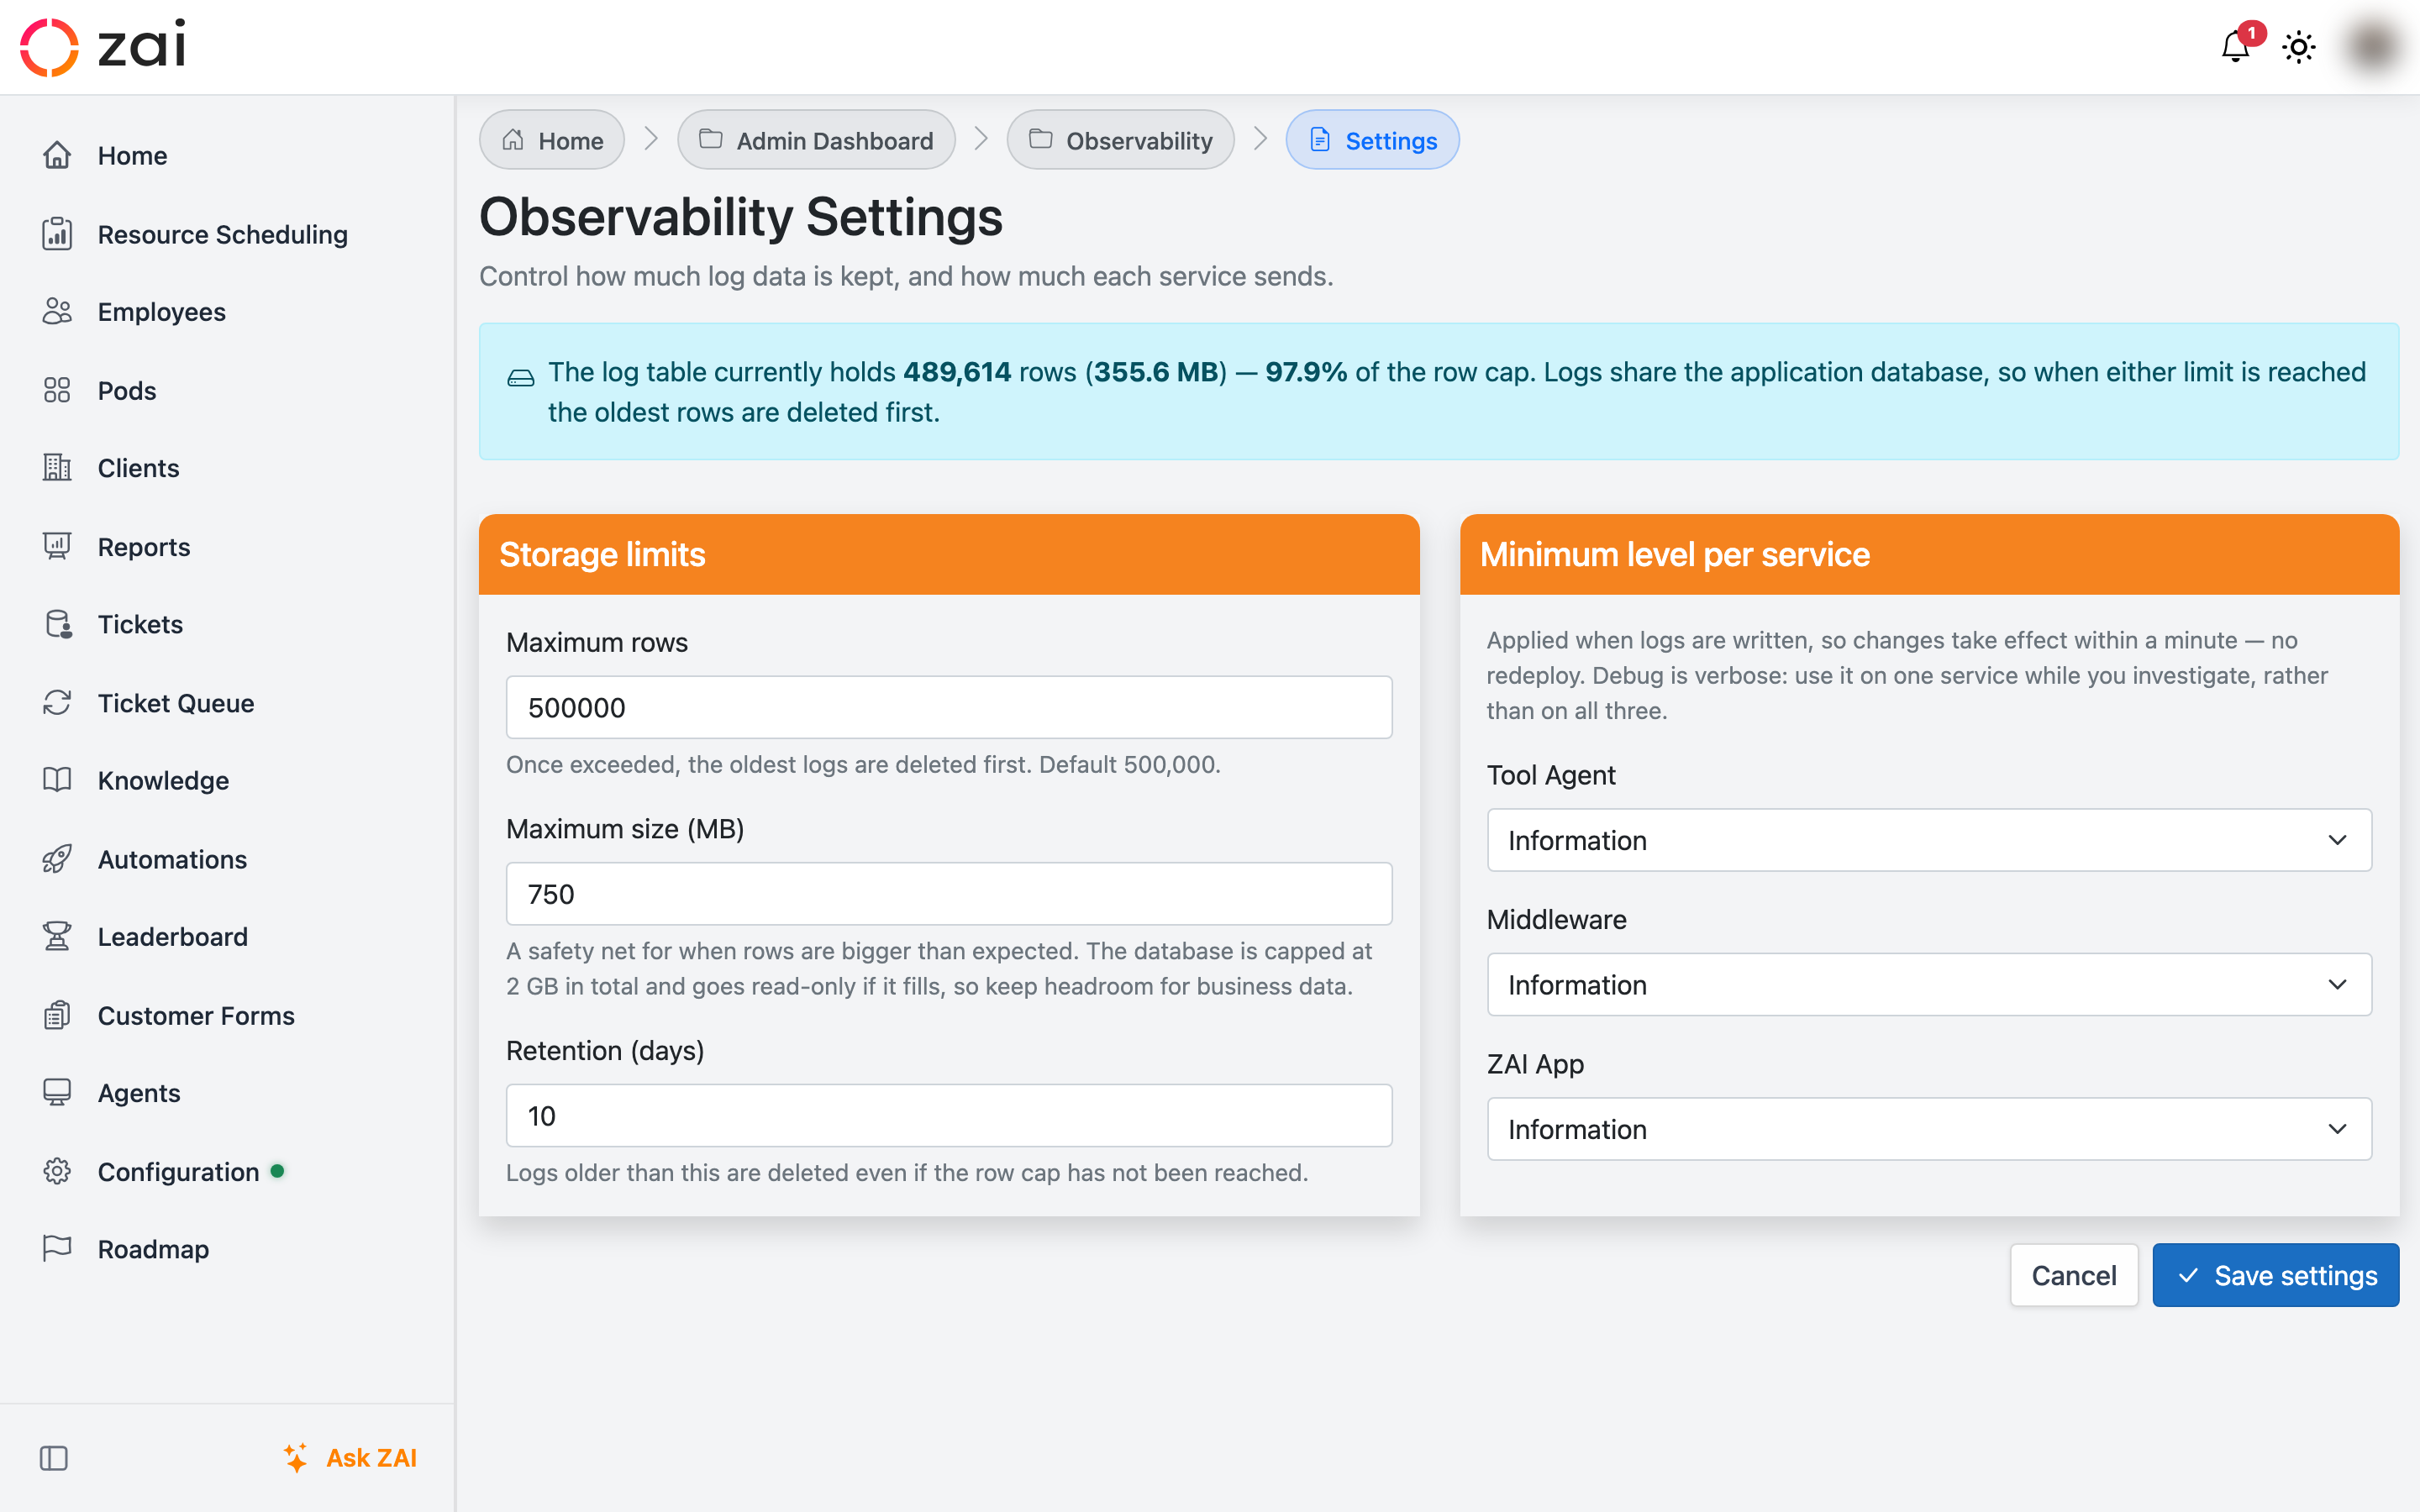
Logs share the same database as your business data, so Observability enforces a hard cap to make sure logging can never fill it up. Three limits apply, whichever is hit first:
| Limit | Default | Purpose |
|---|---|---|
| Maximum rows | 500,000 | Row-count cap |
| Maximum size | 750 MB | Safety net for unusually large log rows |
| Retention | 10 days | Age-based cleanup, independent of the size caps |
Once a limit is exceeded, the oldest log rows are deleted first. A background sweep checks these limits continuously and cleans up in small batches, so a single cleanup pass never locks the table for long.
Adjust these under Observability → Settings. The settings page also shows current usage — row count, size in MB, and the percentage of the row cap in use — so you can judge whether your caps are comfortable before you tighten them.
Headroom matters
The application database has a fixed total size. If Observability's logs fill it, the database goes read-only — not just for logging, but for the whole application. Keep meaningful headroom between your log cap and the database limit.
Minimum log level per service
Each service — Tool Agent, Middleware, ZAI App — has its own minimum level setting on the Settings page (Trace through Critical). Anything below the configured level is dropped before it's even queued.
This is applied at the point logs are written, so a change takes effect within about a minute — no redeploy required. Because Debug-level logging is verbose, it's best used on a single service while you're actively investigating something, rather than left on across all three.
How ingestion works
Logs are shipped from each service into a shared queue rather than written directly to the database. Observability drains that queue in batches and writes each batch to the log table in one bulk operation, rather than one round trip per log line. This keeps ingestion cheap even under heavy log volume, and means a burst of logging in one service doesn't translate into a burst of individual database writes.
Troubleshooting
The KPI tiles or a chart show no data / a loading error. Each section (KPIs, volume chart, top exceptions) loads independently, so one slow or failing query doesn't blank the rest of the page. Check the log explorer itself for an Observability-sourced error around the same time — the failure is usually recorded there.
Recent activity from a service isn't appearing. Check that service's minimum log level on the Settings page — if it's set above the level you expected (for example, Information when you expected Debug), those logs are filtered out before they reach storage.
Storage usage is close to the cap. Either raise the row/size limits on the Settings page (if you have headroom in the database) or lower the retention window / per-service log levels to shed volume faster. The usage banner on the Settings page shows exactly how close you are.